Four Steps. Sixty Seconds. Complete Clarity.
Open TradingView
Pull up any symbol with the WaveTech indicator suite applied. Stocks, futures, crypto, forex — any market, any timeframe.
Copy data window
Select and copy the indicator values — PPM, WTAR, and MarketGrid from TradingView's Data Window. That's all TradeIQ needs.
Execute your plan
In 60 seconds, get your complete analysis sheet — exact support/resistance price targets, probability scores on every level, and a clear execution framework.
Paste into TradeIQ
Drop the data into the TradeIQ analysis engine. It validates your data instantly and tells you exactly what it found.
No guessing. No opinions. Just the trade.
For nearly a year, traders have been asking for the ability to run these analysis sheets on any symbol they want. After working through multiple technology platforms, TradeIQ is the answer — paste your TradingView data, and in 60 seconds or less, get a complete analysis sheet you can view on screen, print, or save as a PDF.
It's simple: follow the four steps above, and you're running sheets. You can analyze up to 10 symbols at a time. New members get 10 free credits to start. This is just the beginning — TradeIQ is the first of multiple products coming to this platform.
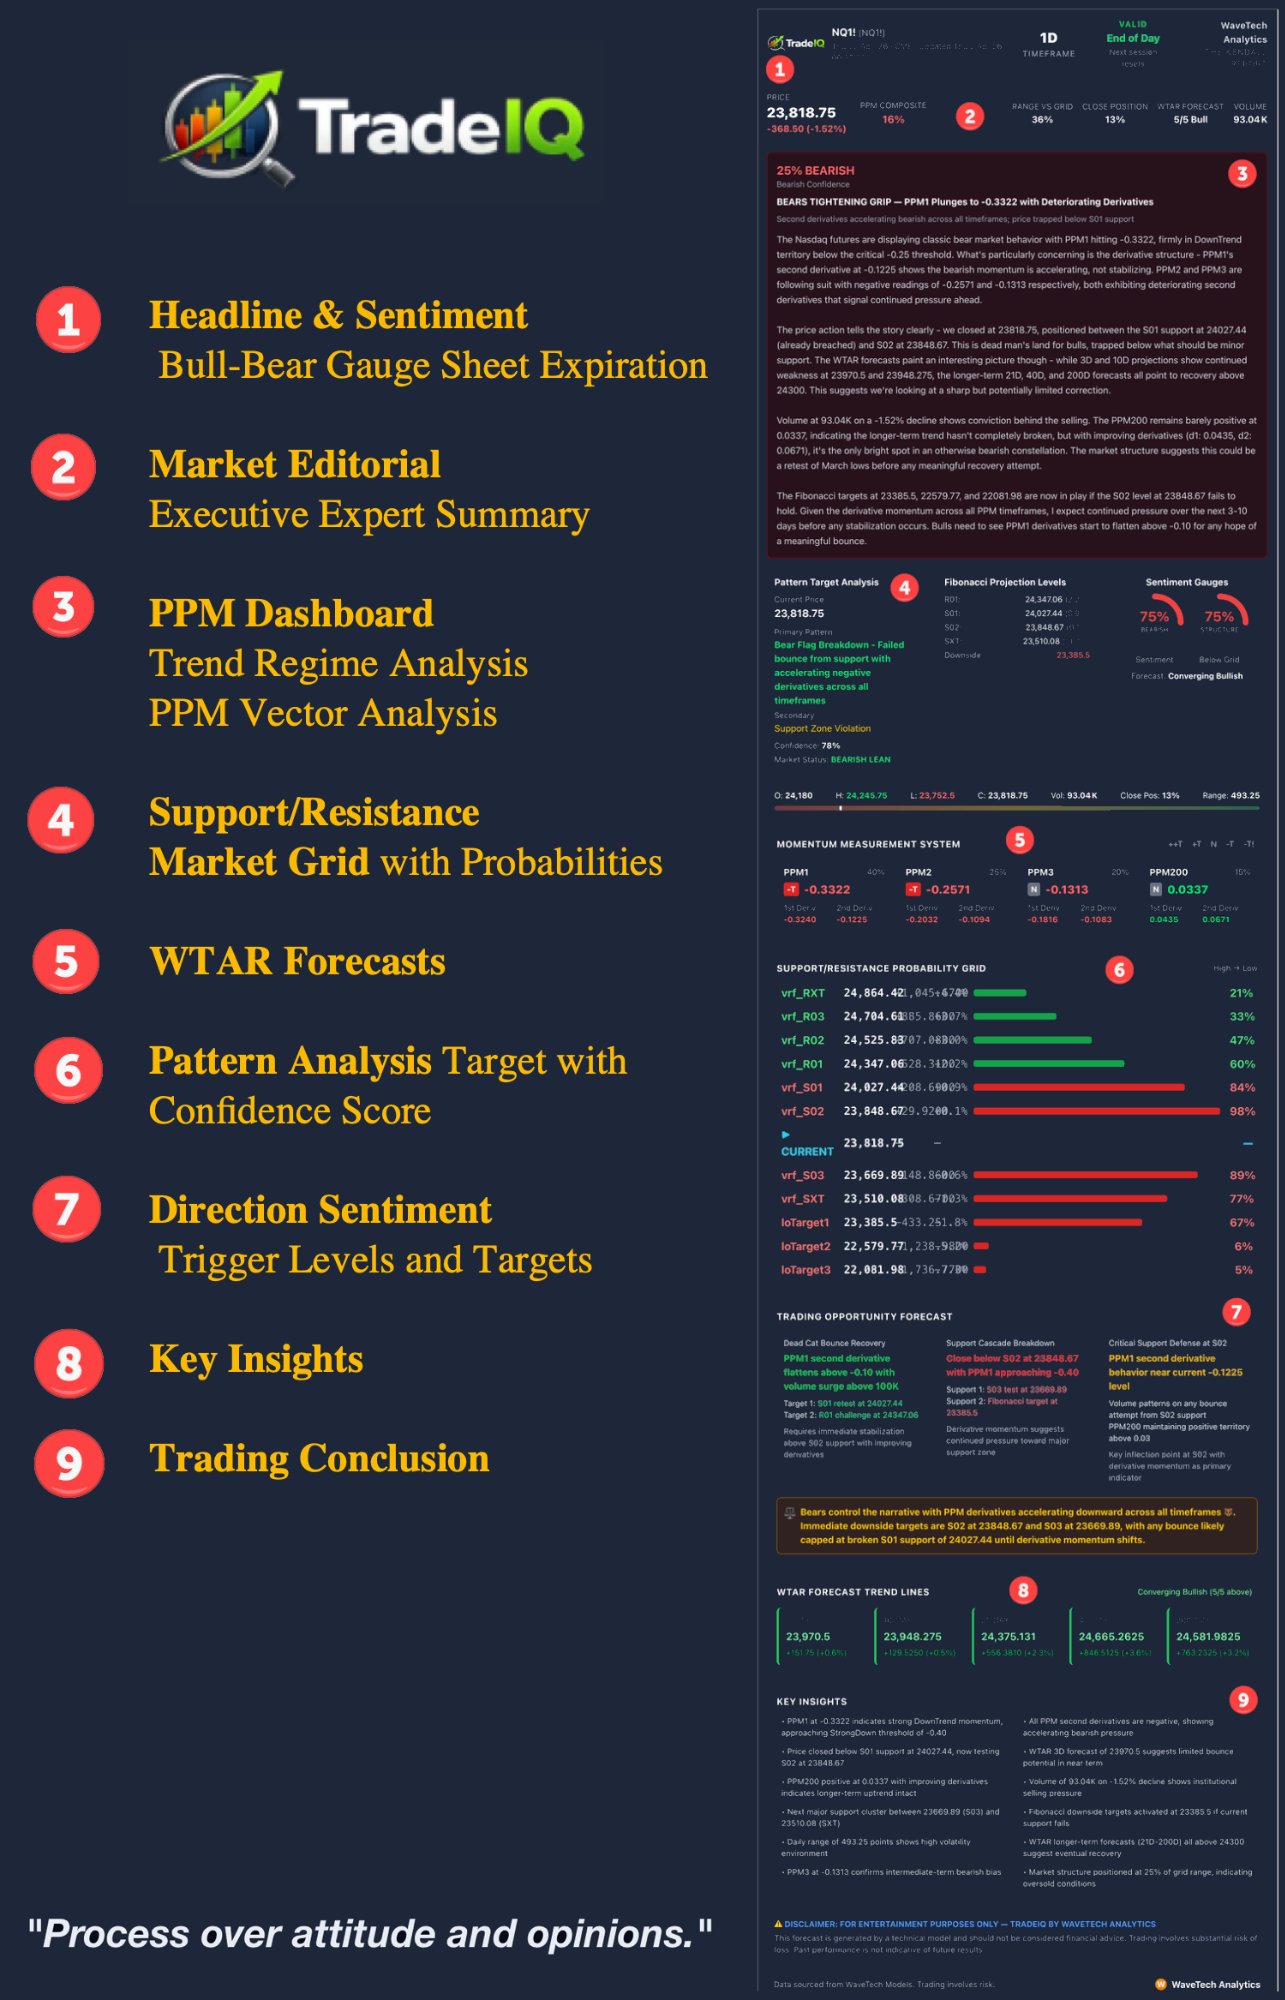
Your Complete Analysis Sheet
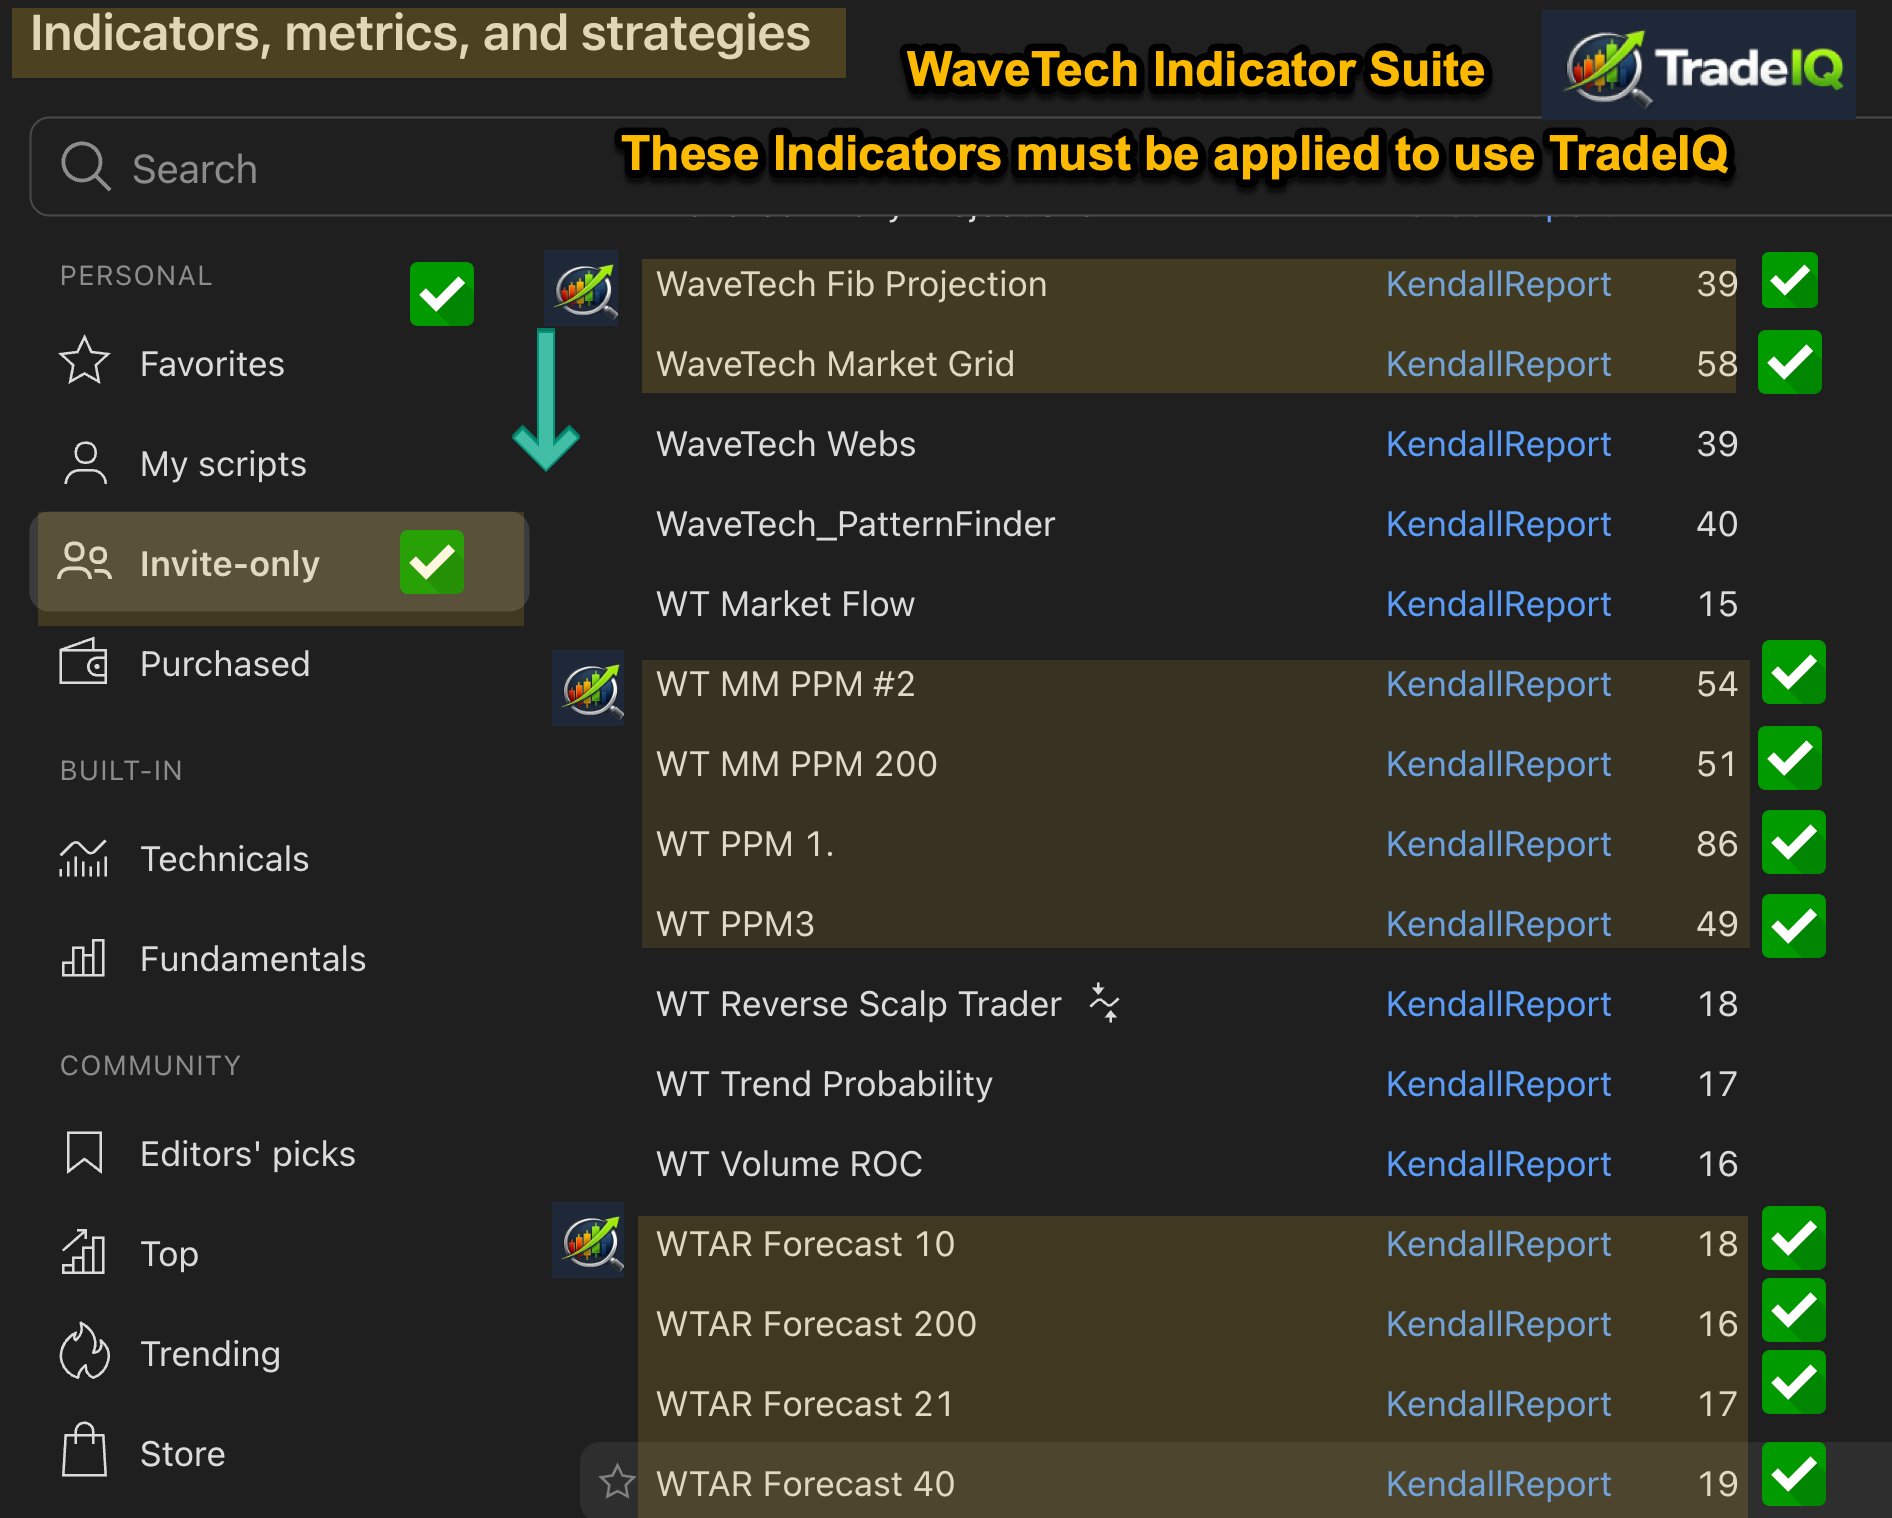
Required Indicator Setup
These 10 WaveTech indicators must be loaded on your TradingView chart plus one duplicate entry with modified settings — 11 total. TradeIQ validates your data before generating — if any indicator is missing, you'll see an error.
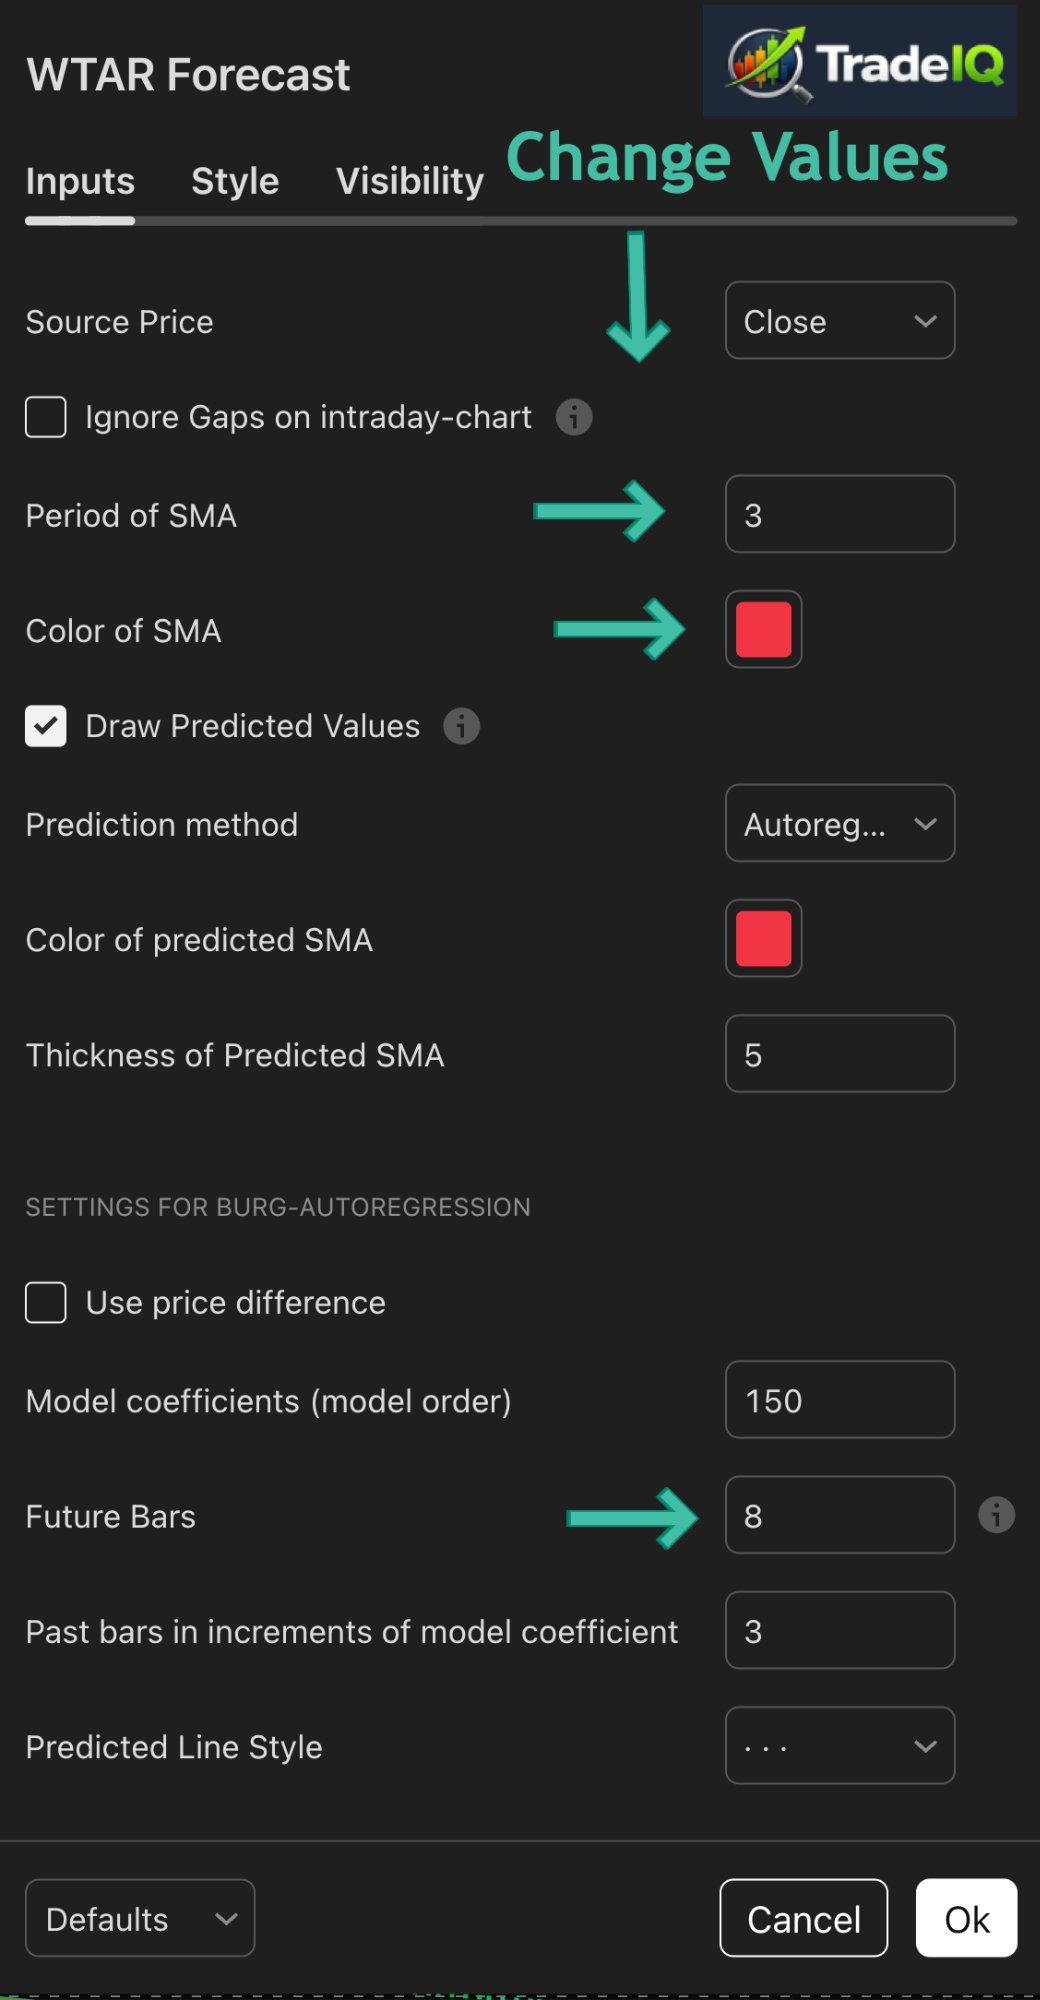
Add WTAR Forecast 10 a second time, then change these settings:
Leave all other settings at defaults. Click OK to save. This creates the 3-day moving average projection that estimates where the close will be the next day.
Click Indicators → Invite-only → Select all WaveTech/KendallReport indicators
2. Click the "TradeIQ Chart Setup" button above
3. Chart opens in View Only mode
4. Click "Make it mine" or the Copy icon (top right)
5. Name it (e.g., "TradeIQ Setup") and click Save
6. All indicators are now loaded — change to any symbol
Change Period to 3, Color to Red, Future Bars to 8
Price Pressure Momentum: The Angle of Attack
TradeIQ turns what you can see on a chart into what you can act on with confidence. By quantifying the angle of attack — how aggressively price is moving relative to its moving average — we transform subjective chart reading into mathematical probability. The steeper the angle, the higher the probability. No interpretation. No guessing. Just clear, high-confidence trading decisions backed by 46 years of quantitative methodology.
The PPM system measures the angle of attack of price relative to its moving average. A steeper angle means stronger momentum and a higher probability that the moving average will hold as support or resistance.
Four PPMs operate simultaneously — PPM1 (10 SMA), PPM2 (21 SMA, primary trend), PPM3 (40 SMA), and PPM200 (200 SMA) — each measuring direction and probability on its associated moving average, regardless of timeframe. The probability shifts approximately 1% per bar on any time series.
Each PPM carries two derivatives: D1 measures the speed of change, D2 measures acceleration. D2 turns before D1, D1 turns before the PPM value, and the PPM turns before price — creating a sequential early warning system.
TradeIQ translates these readings into a composite score that drives the probability at every support and resistance level on your analysis sheet. You don't calculate anything. You read the result.
Each PPM is tied to a specific moving average
Any timeframe: 15m, 1H, 4H, daily, weekly, monthly — probability shifts ~1% per bar
The angle determines probability
Steeper angle = stronger momentum = higher probability of holding
PPM threshold zones
Example: declining market
Price below 21 SMA — SMA acts as resistance — PPM2 negative
What the TradeIQ sheet delivers
Drives probability at every level — the sheet does the math for you
Derivatives: the early warning system
Sequential early warning system across all four timeframes.